Error: Unable to read data from the transport connection: The connection was forcibly closed
Created by Damien Zwillinger, Modified on Thu, 5 Oct, 2023 at 9:34 PM by Damien Zwillinger
Applies to:
- Velixo NX
- Velixo Classic
- Acumatica, Cegid, MYOB
Symptom
When calling one of the Generic Inquiry functions (e.g. GI or GILOOKUP), the following error message appears:
or
Except text from error message
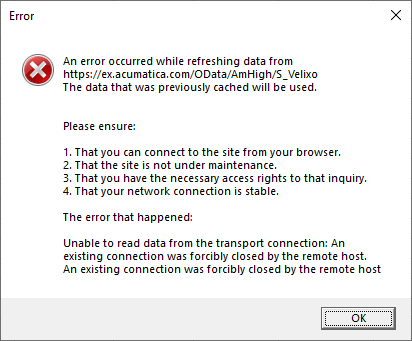
An error occurred while refreshing data...
The data that was previously cached will be used.
Unable to read data from the transport connection: An existing connection was forcibly closed by the remote host.
or
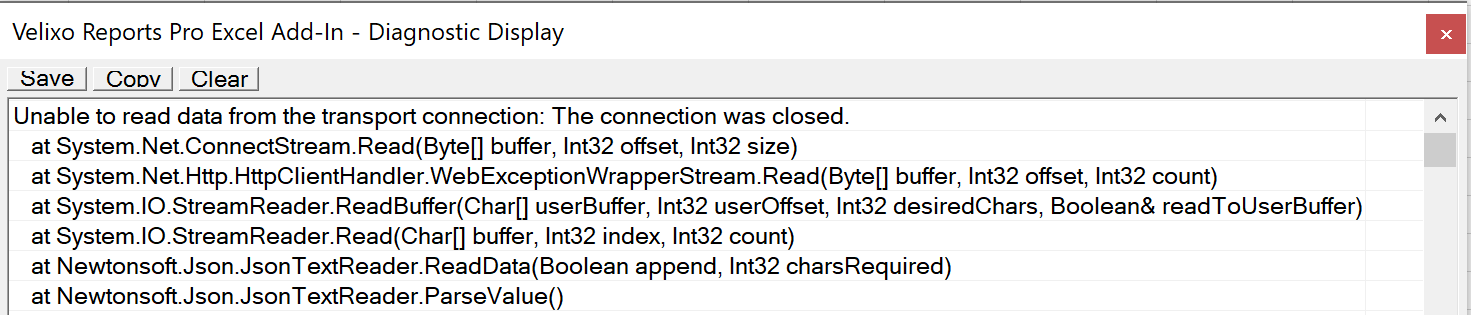
Unable to read data from the transport connection: The connection was closed.
Possible Cause
In our experience, the errors of this class are most often caused by a server-side Acumatica failure.
NOTE that the inquiry may still work fine when viewed through the Acumatica interface (e.g. when you click the VIEW INQUIRY button). The bug occurs specifically at the OData interfacing level.
To verify this is not a Velixo issue, you can open your Web browser and navigate to:
https://[your-acumatica-address]/OData/[tenant-name]/[inquiry-name]
(enter your Acumatica credentials if needed). For non-problematic inquiries exposed via OData, for example BI-Dates , you will see an XML or JSON result set.
For a problematic inquiry, you will see a truncated result or a blank page.
This issue has been escalated to Acumatica (case #147464) and is still under investigation.
Resolution
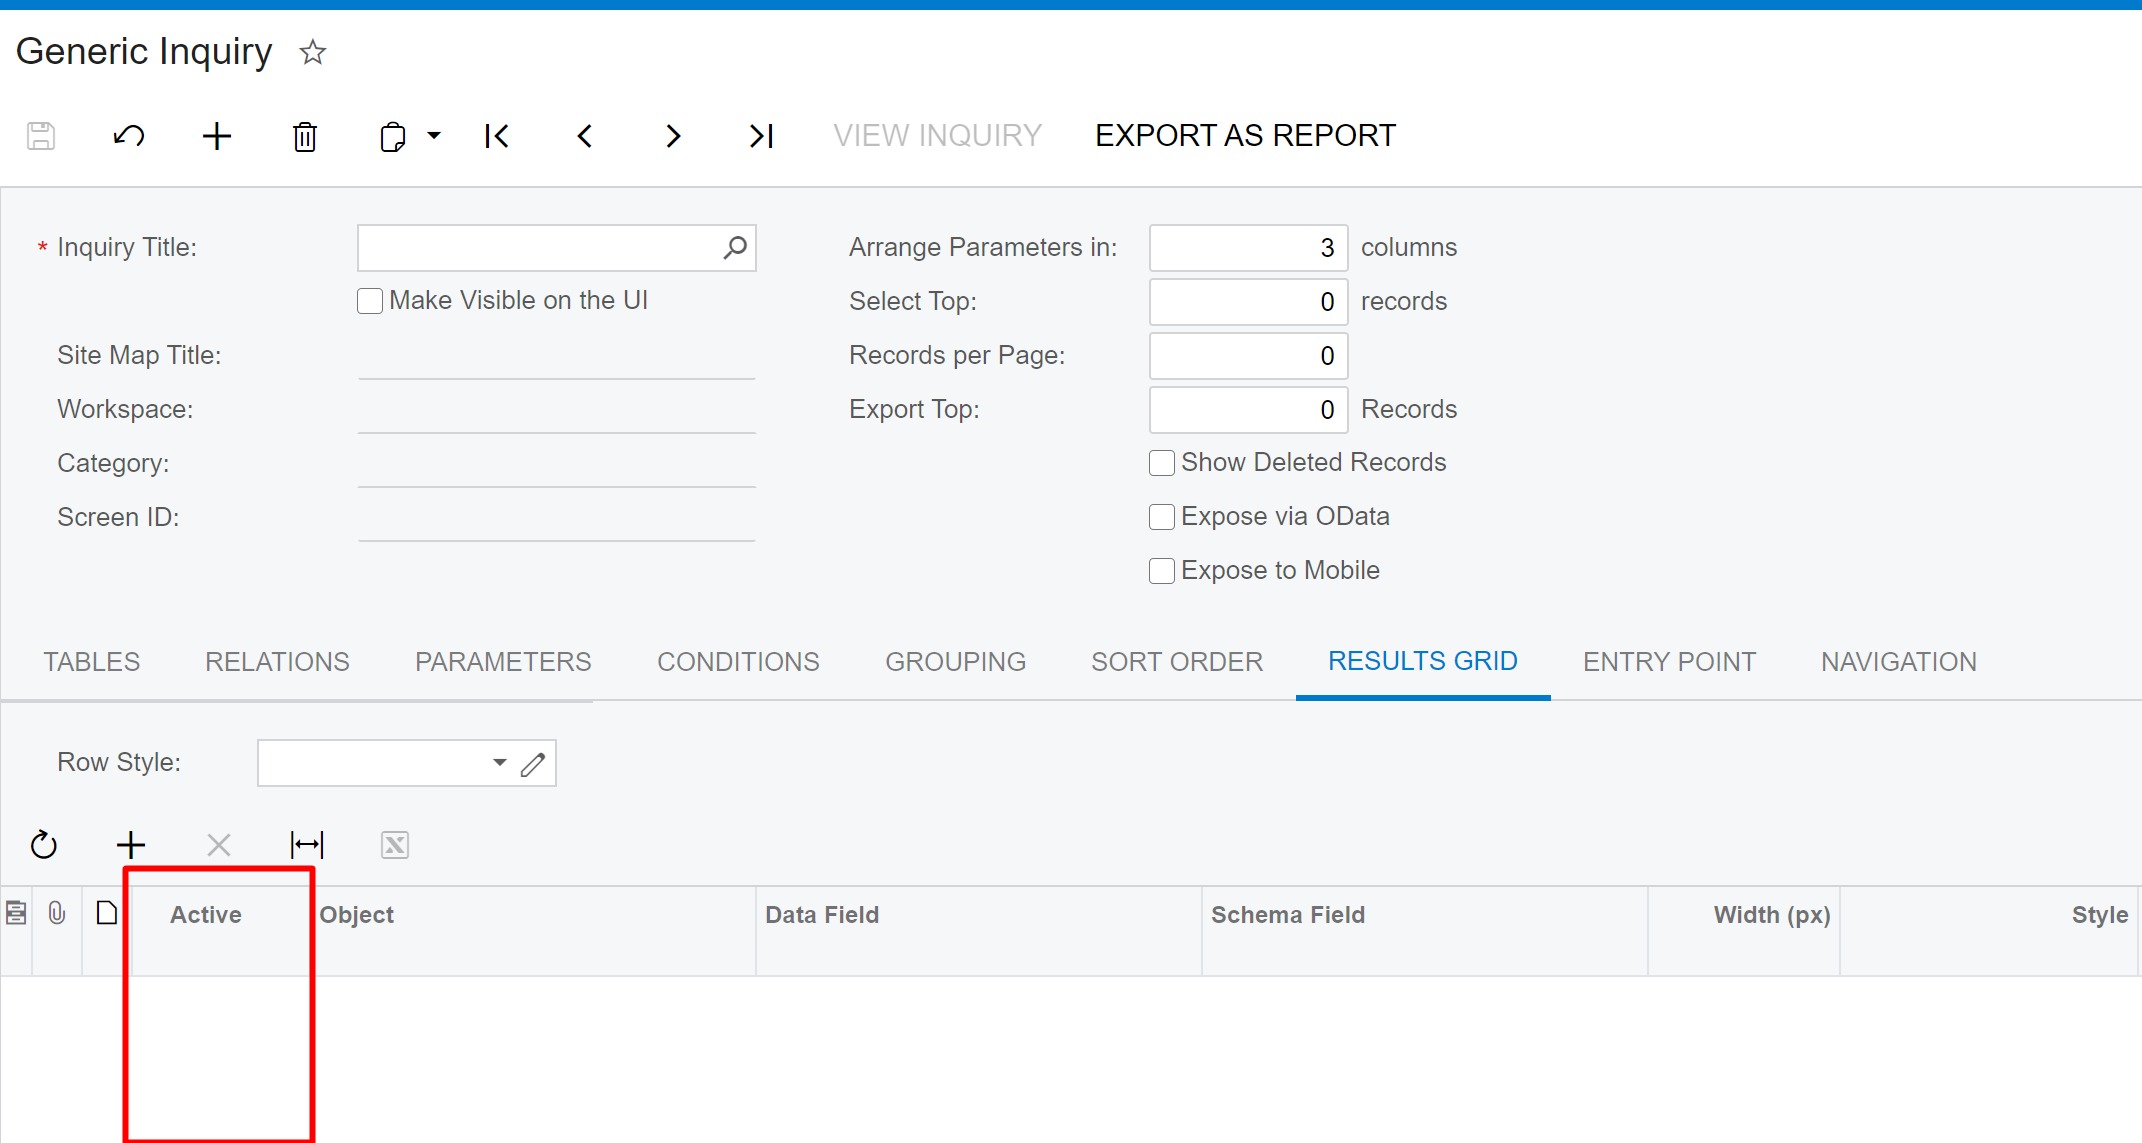
The Active column on the results grid, controlling whether the column is displayed in the Generic Inquiry
First, locate which column is causing problems using the following algorithm:
Navigate to the Generic Inquiry screen in Acumatica and open the problematic GI.
Navigate to the Results Grid tab as per the screenshot above.
Uncheck the Active checkbox for the first row. This will remove the respective column from the Generic Inquiry.
Click Save.
Do a Full Refresh in Velixo and see if the problem persists.
If it does, repeat the process for the second, third, fourth, etc inquiry column. After each,
disable the operation
Save
do a full refresh in Velixo
Once the error disappears, you've found the problematic inquiry column.
Turn back on all the columns that you disabled previously, except the problematic one; save again.
Review the problematic inquiry column.
If Schema Field is specified for the column, ensure that it matches the data type for the column - misconfiguration here often results in this error. If this was the root cause, after fixing it, activate the inquiry column again and verify that the error has disappeared.
Otherwise, if it didn't help, or if the Schema Field was not specified for the column at all, the only workaround is to keep the problematic inquiry column disabled and get in touch with your support contact about the issue.
Was this article helpful?
That’s Great!
Thank you for your feedback
Sorry! We couldn't be helpful
Thank you for your feedback
Feedback sent
We appreciate your effort and will try to fix the article